
This is Mitchell, here today to briefly discuss the focus of my research as part of our group’s larger effort to understand vegetation dynamics along treeline in central Canada.
The world’s northern high latitudes are warming more than the rest of the world, leading to a variety of environmental changes (such as northward vegetation expansion) in this area. The goal of my research is thus to assess recent vegetation growth and expansion across the forest-tundra ecotone (treeline) of central Canada. This will involve utilizing a remote sensing vegetation index (normalized difference vegetation index – NDVI) and identifying the landscape-scale factors (i.e. topography, water bodies) that most influence potential vegetation expansion in this region. NDVI is a proxy for vegetation photosynthetic activity, or “greenness”, and is equal to the near infrared minus the red spectral band from a Landsat satellite image divided by the sum of those two bands.
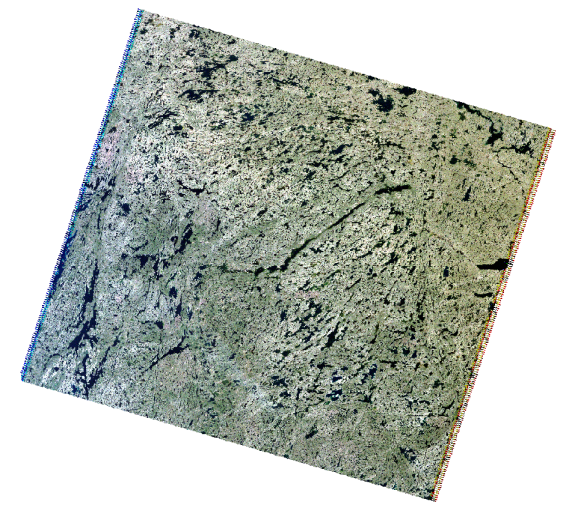
Landsat satellite image example from frame 47-15 (field study area).
The first section of my research is based on the remote sensing analysis of Landsat satellite imagery. This involves the creation of an NDVI time series (1984 to present) that shows changes in vegetation productivity over time and space in the study area. In order to accurately assess NDVI, however, a variety of steps must be taken first to ensure the imagery is in proper form for analysis. 39 mostly cloud-free Landsat scenes were downloaded from the USGS Global Visualization Viewer. These scenes must then be corrected for various anomalies due to changes in sun angle, atmospheric effects and other factors that can influence final NDVI values. Any clouds and cloud shadows that are found in the imagery must be masked over as well. Once all the scenes have been “normalized” to each other (and masked for clouds) NDVI analysis can take place. An important aspect of my project is seeing how NDVI changes are influenced by changes in topography, which is done through the use of a digital elevation model that can be used to break the study area up into different terrain types.
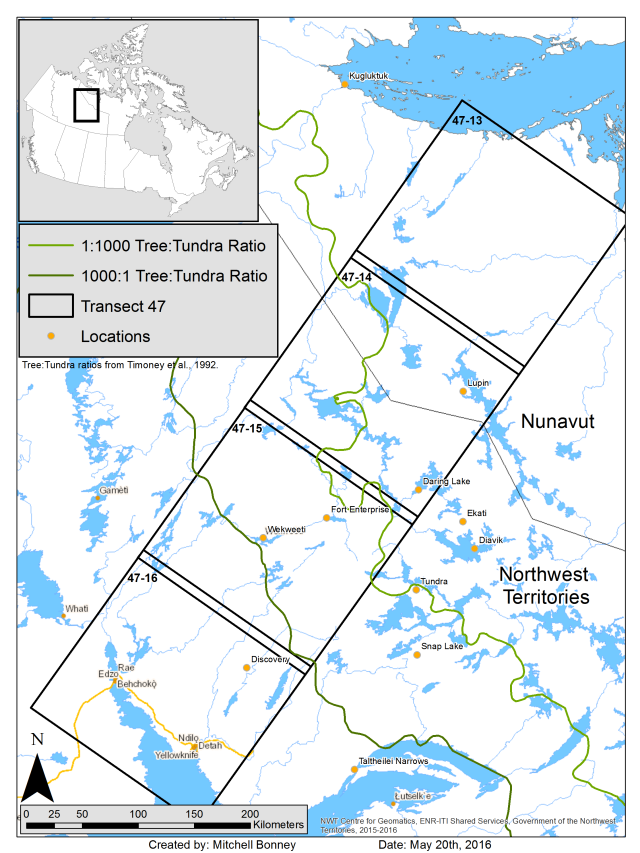
Remote sensing study area. Boxes represent different Landsat satellite image frames. Field work will be conducted in frame 47-15 (see Fort Enterprise and Wekweeti locations).
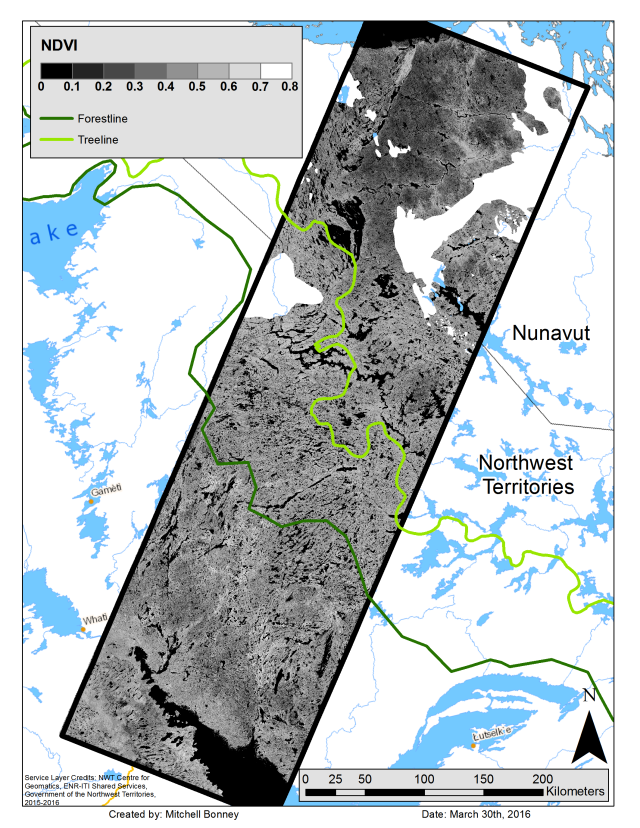
Study area NDVI from most recent (mostly) cloud-free imagery available. NDVI closer to 1 (lighter pixels) are more productive, while NDVI closer to 0 (darker pixels) are less productive. Holes in northern section of the image are areas that were masked because of cloud cover.
The goal of the on-the-ground measurements that I will be carrying out in central Northwest Territories is to determine the relationship between NDVI and an actual environmental variable. Along our canoe route through treeline in central Northwest Territories my colleagues and I will be setting up a number of 30 m x 30 m plots where the heights of different vegetation functional groups (i.e. pine trees, birch shrubs, grasses, moss etc.) will be collected at points along a 5 m interval. This should give me a good approximation of the vegetation volume (length of plot * width of plot * vegetation height) of the plot, which then can be linked to the NDVI value of that area through statistical techniques such as linear regression in order to help determine the accuracy of the satellite image analysis. In addition to collecting vegetation height measurements, we will also be gathering information on site elevation, slope angle, vegetation percent cover, moisture regime, soil characteristics and other variables in order to gain as much knowledge about the area as possible.
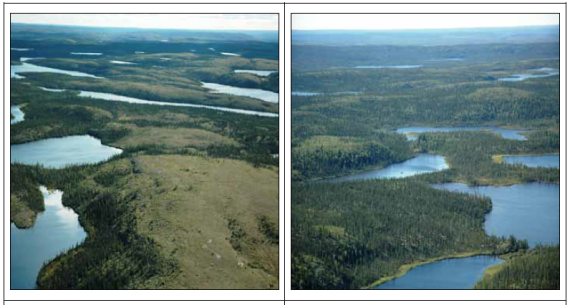
Left: typical landscape of more northern high sub-Arctic areas in central NWT, with forested areas in sheltered locations and tundra on hilltops. Right: typical landscape more southern low sub-Arctic areas in central NWT, where hilltops are often tree covered. From GNWT Ecosystem Classification Reports.

Fascinating work!
LikeLike
Pingback: Fieldwork Power Needs – The Challenge | C²T²